
The Trade Fair Industry in Asia, 16th edition
An UFI Report researched and compiled by Business Strategies Group
EXECUTIVE SUMMARY
This Executive Summary is extracted from the 16th edition of the full report, The Trade Fair Industry in Asia, which consists of over 130 pages of data and analysis. Business Strategies Group Ltd. (BSG) produced the report in Hong Kong on behalf of UFI, the Global Association of the Exhibition Industry. It is designed to provide those working in the industry or with an interest in trade fair data with a ‘roadmap’ of the industry in Asia: key players, the size and structure of the industry and our views on where it is going. The views are those of the writers of the report and do not necessarily represent official UFI positions.
COVID-19 impact on forecasts for full year 2020 and 2021
The industry is in the midst of an unprecedented global crisis. This report covers actual performance of the industry in 2019, as well as forecasts for the years 2020 and 2021. Overall, BSG estimates that Asia will record an unprecedented 75% drop in net space sold in 2020 compared to 2019. This means net space sold is expected to fall from the 24.5 million m2 recorded in 2019 down to just 6.8 million m2 in 2020.
Even to achieve this result, a great deal depends on the market in China, which accounts for nearly 60% of net space sold in Asia. If China avoids a significant second or third wave of infections, 6.8 million m2 sold in 2020 across the region is achievable. If China experiences another outbreak and returns to lockdown, the actual results in 2020 will be significantly lower.
Of the large markets in Asia, China is expected to record the strongest performance in 2020 with a drop in net space sold of 65%. Japan, the second largest trade fair market in Asia, is expected to record a decline of 75%. Markets with highly international trade fairs, including Hong Kong and Singapore, will post a 90%+ decline in net space sold in 2020.
In 2021, our forecast for the Asia Pacific region is net space sold in the range of 50% to 60% of 2019 levels – with China expected to outperform all other markets. In 2021, China is expected achieve 70% to 75% of net space sold in 2019 – barring a significant new outbreak of COVID-19.
In 2021, Asia’s second largest trade fair market, Japan is forecast to record 40% to 50% of space sold in 2019, hampered by the on-going closure of key venues needed for the postponed Olympic games. Of course, the forecast for 2021 is particularly challenging due to the long list of potential unknowns, including possible waves of new infections in any market, the timing and severity of government restrictions in each market, travel restrictions, etc.
Summary of the trade fair industry in Asia in 2019
BSG’s research shows that 24.5 million net m2 of space was sold by exhibition organisers to their clients in Asia in 2019. This represents growth of total net space sold in 2019 of 4.8% – up from 23,377,500 m2 in 2018 to 24,496,750 m2 in 2019. Of that total, nearly 60% was sold in China and 9% in Japan. Among the close to 2,500 Asian trade fairs included in BSG’s database, 750 were held in Mainland China, compared with 300 in Japan – the region’s second largest market.
Table 1: Trade fair markets by estimated net square metres sold, 2019

Source: BSG research
In 2019, the exhibition industry in Asia grew by 4.8% in terms of space sold – the same year-on-year increase as in 2018 (vs. 7.0% in 2017 and 5.5% in 2016). One of the smallest markets, Cambodia, became the fastest growing market in 2019 (up 11%), followed by India (7.4%), Philippines (6.5%), Vietnam (6.3%) and China (6.1%).
Among the large markets, India and China both grew faster than the regional average. Other large markets recorded more moderate growth. Net space sold in Hong Kong increased by 3.0%, while Australia grew by 2.9% and Korea by 2.7%. Japan was the only market to contract in 2019, falling by 1.2%.
By industry
General goods became the top category this year, accounting for 2,942,750 m2 of space sold – followed by the engineering / industrial goods category with 2,672,500 m2 and furniture with 2,336,000 m2. The five other categories with more than one million m2 sold were F&B (1,931,000 m2), leisure (1,442,000 m2), automobiles (1,319,500 m2), electronics (1,227,500 m2) and textiles (1,068,000 m2). The health (993,500 m2) and premiums (901,000 m2) categories complete the top ten.
The segmentation of space sales by industry has remained quite consistent since BSG issued the first edition of this report in 2005. There is no particularly dominant industry in Asia’s trade fair industry. In fact, only two categories (general goods and engineering / industrial) accounted for more than 10% of space sold in 2019. The furniture, F&B, leisure, automobile and electronics categories accounted for between 5% and 9%. All other categories accounted for 5% or less of total net space sold in the region.
Figure 1: Space sales by industry, 2019

Source: BSG research
Exhibition Centres
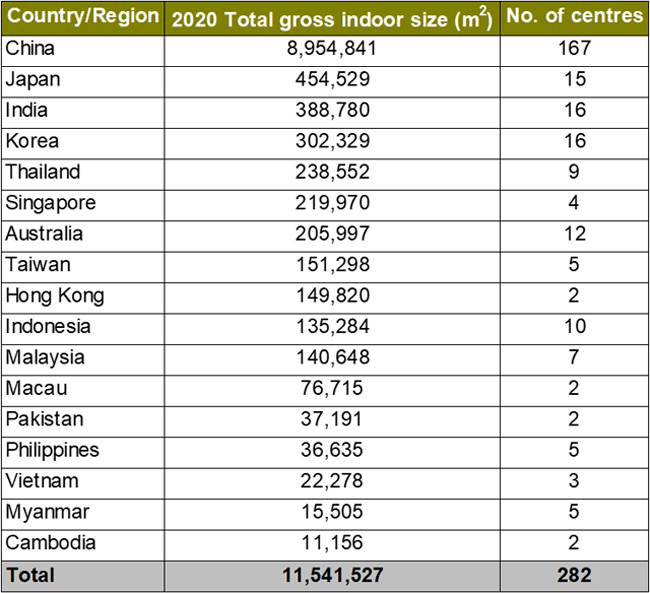
By the end of 2020, there will be 282 purpose-built exhibition venues in Asia. By comparison, there were just 101 venues when BSG published the first edition of this report in 2005.
More than 77% of all venue capacity in Asia is now located in China – a remarkable 19 times more than the capacity of the next largest market, Japan (8.9 million m2 in China vs. 454,529 m2 in Japan).
By the end of 2020, there will be 167 venues in China, followed by India (16 venues), Japan (15), Korea (16), Australia (12), Indonesia (10) and Thailand (nine).
Table 3: Number of venues & total capacity in Asia, end 2020

Source: BSG research
© Business Strategies Group Ltd. 2020
This document and the information it contains may not be copied, reproduced or redistributed in full or in part by any organisation without the express written permission of Business Strategies Group Ltd.
To order this reports, please click on this link
Executive Summary
August 2020


