
 BIIA is delighted to introduce two contributing writers: Dr. Jakob Margolis, Senior Modeler / Jochen Schubert (MBA), Senior Data Analyst / Bisnode Deutschland GmbH
Age of Data Analytics create a need for its own tools
Ever since Boston Consulting Group, McKinsey and Marakon Associates published on portfolio-analysis, it has been covered in scientific literature exhaustively and plays a role as a significant instrument in a manager´s daily life. Specifically, evaluations of portfolios are usually looked at separately from the point of view of “marketing” or “financial risk”. Those approaches are structured in 4 or 9 sections and easy to run, but they cannot identify sub-segments within a portfolio in detail.
But current Data Analytics approaches changed mindsets towards contextual inter-dependencies and provided the option to integrate various data sources for decision-making in portfolio management. For these important reasons the “PRIME” methodology was developed to analyze portfolios multi-dimensionally. The acronym “PRIME” represents the three pillars of this concept:4″P” (=Profitability), 4″RI” (=Risk), 4″ME” (= company´s Market Expansion). Major benefits are the methodical flexibility and it provides not only insights for management, but even transparency into details in (inter-)national portfolio´s structure and it meets the requirements of different functional departments.
Three angles of vision
Profitability is the 1st dimension of the PRIME-method, it´s based on the Bisnode Profitability-Indicator. The Return-of-Investment (ROI) of a company is classified into one of four clusters, according to the distribution of all German cases from the Bisnode Business Universe: 4 “A” = very high profits, 4 “B” = high profits, 4 “C” = low profits, 4 “D” = very low profits.
Risk represents the 2nd dimension and relies on the Dun & Bradstreet (D&B) Risk-Indicator from the generic D&B scorecard for German enterprises, where facts from five modules are assessed to define the probability of default1:
- demographics (e.g. legal form, age of company, number of employees, risk of regions, risk of industry sectors etc.);
- financials (e.g. fixed assets, equity, liabilities, gearing etc.);
- trade (e.g. late payment, billing amount, sum of invoices etc.);
- negative events (e.g. audit remarks, blocked accounts, insolvency proceedings);
- macroeconomics (e.g. GDP, ECB-interest rates, Euro/USD exchange rates, Oil prices, Unemployment rate, etc.)2.
The foundation for the macroeconomic module is a time series analysis, run by VAR-method, over 11 years on a quarterly basis. It comprises the last two world financial crisis of 2003 and 2008/2009. For this reason it delivers representative results. Finally, company´s risk will be allocated into four clusters: 4″1″ = very low risk, 4″2″ = low risk, 4″3″ = risk above average, 4″4″ = very high risk.
Company’s market expansion constitutes the 3rd dimension, set-up by the Bisnode Growth-Indicator. Growth in turnover will be measured by the geometric mean of the respective growth factors on a yearly basis, while its volatility is taken into account. According to the distribution of German enterprises, the outcomes are assigned to four clusters: 4″++” = very high growth, 4″+” = high growth, 4″-” = low growth, 4″–” = very low growth.
After having run these three assessments, the results for each company in the portfolio will be aggregated into the PRIME-indicator, which has three positions:
1st Bisnode Profitability-Indicator: A, B, C, D
2nd D&B Risk-Indicator: 1, 2, 3, 4
3rd Bisnode Growth-Indicator: ++, +, -, –.
The final score for PRIME-qualified companies varies from A1++ to D4–.
New Insights by looking back and forth
For stock taking, a status-quo-analysis of the current portfolio will provide a clear overview on the customer base and how effective marketing and sales have been in the past in acquiring the good ones. For monitoring purposes, a year on year analysis shows the internal changes on the customer´s side e.g. in a migration matrix. Defining the PRIME-profile for future target groups, enables marketing and sales to focus precisely and to work more efficiently.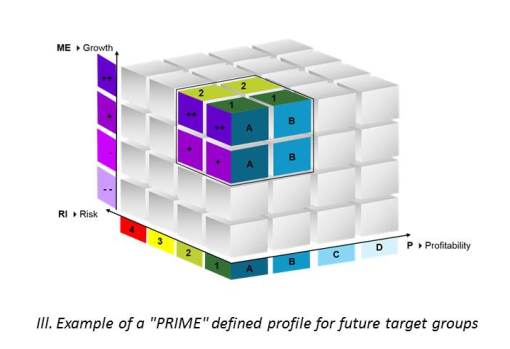
Proven track record
For the proof-of-concept of the “PRIME” method, the German customer portfolio of a large multi-national B2B service provider was analyzed. Here are some insights from it:
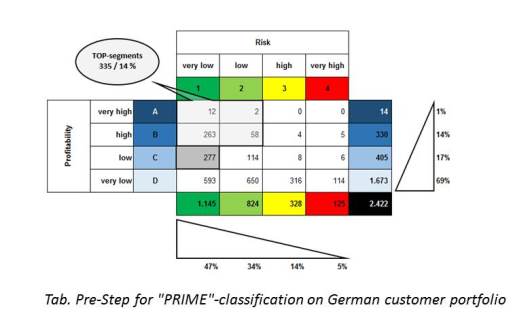
Example 1: In the best clusters A1, A2, B1, B2 there are 335 customers with (very) high profitability and with (very) low risk. But in these clusters 8% of customers have a negative trend in their turnover development, which are of course of special interest.
Example 2: In cluster, C1 there are 277 customers. However, from companies with very low risk and low profitability, but 27% have a poor performance in their market expansion with below median growth.
The “PRIME” method was originally developed on German Bisnode and D&B data, but this approach is generally open and can also be applied to an international portfolio analysis. Generally, this approach can be executed for portfolio-owners in two versions, whilst “PRIME I” is solely based on external data, “PRIME II” also makes use of internal data (i.e. (in-)direct figures for turnover per business partner). Based on the distribution within the risk categories, a portfolio-owner can re-evaluate his degree of dependency on key accounts, the contribution of middle-class, low-end business partners and which ones are the “bad apples” within his portfolio.
For the following example on real data, customers have been classified into a traditional A/B/C-segmentation. The descending size of turnover and their cumulative weight of sales figures is differentiated according to their risk assessment.
In this case the 5% most important A-customers represent 31% of total turnover, which are luckily only allocated within the best two risk categories, while B- and C-customers represent further 32% and 37% of total turnover of the portfolio-owner.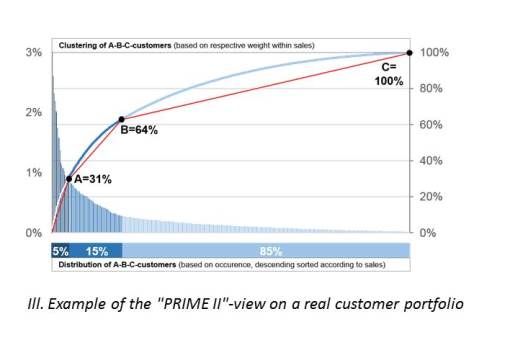
We seriously recommend analyzing further cluster risks due to linked business partners within the same company groups to be able to identify and manage real key accounts. In this case 9% of total turnover are affected by linked relationships across all three customer-categories. These major insights allow separation of the “goods” (A1) from the “bads” (C3+C4). An individual scoring model can be created to identify new future potentials for promising acquisition.
SUMMARY: “PRIME” – the new “Swiss Army Knife” for managers
The primary use case is to analyze customer portfolios for marketing and sales, but it will also
enrich credit management to define even more adequate credit limits and payment conditions. Another use case is the evaluation of current and future strategic suppliers for the buying department.
The “PRIME” method takes major relevant perspectives into account to analyze B2B-portfolios. It provides an integral view of a portfolio and the essential transparency on its sub-levels. Hence, management is enabled to run such multi-dimensional analysis as:
- status-quo-analysis of a portfolio;
- year-on-year monitoring analysis;
- selection of business partners based on a “PRIME” defined target group profile.
Consequently, requirements of many functional directors are covered. CRM-strategy, therefore, benefits from a comprehensive overview of a portfolio and it can be transferred precisely into operational steps for finance, marketing, sales and even buying departments.
The “PRIME I”-version is solely based on external data (profitability, risk, growth). In a symbolic way it enables analyzing the “anamnesis” of the portfolio-owner from the perspective of a “general practitioner”. Whilst the “PRIME II”-version is also based on customer-internal data, it provides a much deeper specialized “diagnosis” from the point of view of an “internist”.
References:
- Margolis J. Forecasting the macroeconomic risk of industries and probability of default for companies in Europe. EViews/IHS, First User Conference, Frankfurt, 21.-22. October 2014.
- Margolis J., Brackrogge A. Default Scoring für Unternehmen in europäischen Ländern und Optimierung für spezielle Portfolios. SAS Forum Deutschland, Bonn, 2010.
About authors:
 Dr. Jakob Margolis is an analyst with many years of experience in risk management and marketing for B2B and B2C. Since 2009 in his role as Senior Modeler, he has developed scorecards for European countries and customer portfolios for Dun & Bradstreet and Bisnode Deutschland GmbH. He previously specialized in dialogue marketing and CRM for over eight years at Schober Direct Media GmbH. Most recently, he has created macroeconomic risk models using time series analysis and economic forecasts for German industry sectors.
Contact: jakob.margolis@bisnode.com
 Jochen Schubert graduated in business management and recently successfully completed his MBA in Sustainability Management. He is an acknowledged marketing specialist and gained practical experience in several sectors as product manager and marketing consultant for B2C and B2B. He has worked for Dun & Bradstreet and Bisnode Deutschland GmbH for over 9 years. In his current role as Senior Data Analyst, he develops strategic concepts and implements own product ideas. Contact: jochen.schubert@bisnode.com